Last Thursday 100+ people crammed into a fireside on Growth and Product.**
This blog post covers the conundrum of Statistical significance in A/B experiments:
1. why the size of uplift is important
2. how much data gives me statistical significance?
3. how long you have to run an experiment (you will be shocked)
4. are you better tossing a coin?
5. what you pick may delay experiment cadence.
Lets start with this top-level discussion (** with Jordan from Deputy)
Firstly, here are some links if you are interested in the basics and maths of A/B testing.
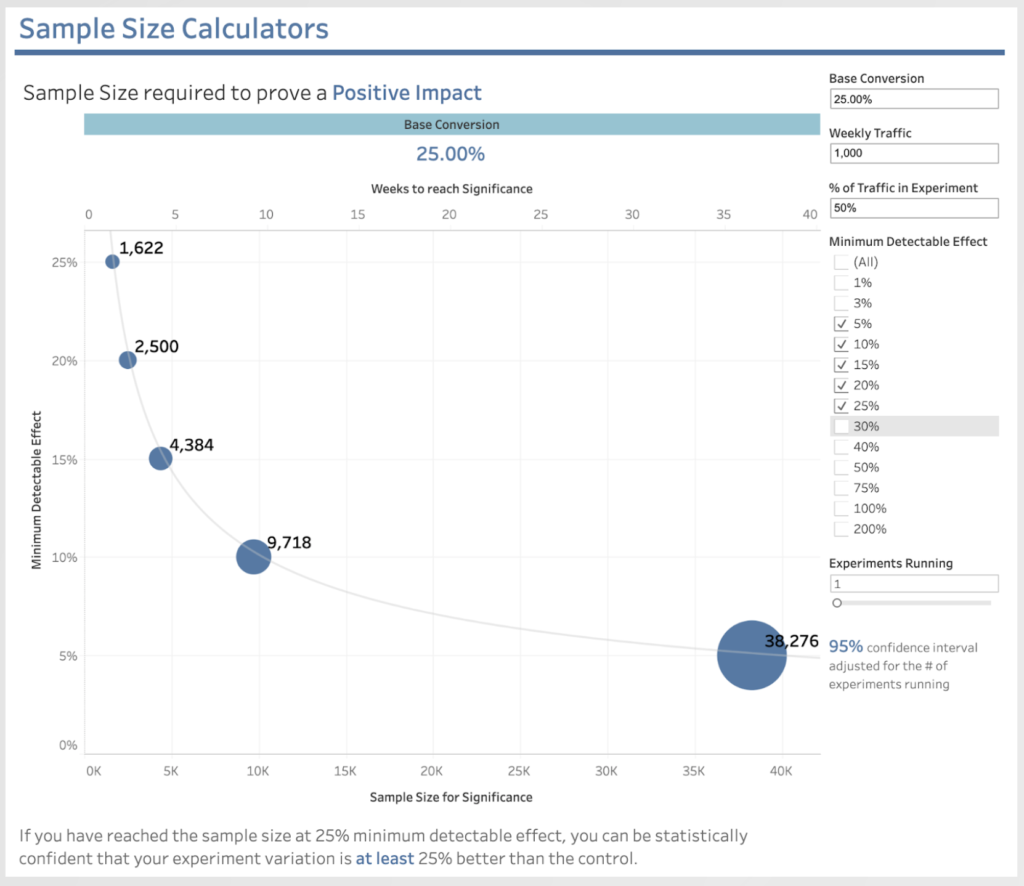
Jordan illustrated the point with this chart. The curve shows practically even large startups have volume challenges. Even with 1000 customers/week entering a 50:50 A/B test, if you only are looking for 5% uplift on an existing 25% conversion, then you would need to wait 35 weeks for statistical significance!
Only then can you make a data-driven decision.

You have a lot of things to agonise over when you are losing prospects in your funnel (whether it be registration, activation or getting a payment) – which elements do you pick? Which fields do you remove (please refer to my earlier Deputy blog post on trialler incentives). So you need to pick your A/B experiments carefully.
Simply put: Jordan makes the point that you can only run one experiment (on a page/process) until you have a “winner”. Then you can start the second. This means that elapsed time will hamper your productive output (per year) as a Product or Growth team.
Gut-Data-Gut – There is a wonderful talk from Stanford about how you need to optimise with the expertise and prudence of your team. Because of time constraints:
A) you MUST make bets on the biggest upward movers of statistical significance.
B) you MUST make bets on the smallest downward movers of statistical significance if the experiment fails (your failures are NOT glorious).
Monitoring both impacts is critical to ensure you are converging on the best experiments and not doing damage in the process!


