Category: statistical significance

  • For mobile user onboarding. Does the world really love Android more than Apple?

    For mobile user onboarding. Does the world really love Android more than Apple?

    Smartphone manufacturers are clearly the earliest proponents of sophisticated digital product adoption techniques like mobile user onboarding flows and product walkthroughs but how are they faring in their global battle for hearts and minds? 

    A report by Electronics Hub in 2021 showed that out of 142 countries, 74 prefer Android over Apple 65 with Belarus, Fiji and Peru showing a draw.  The survey methodology described in the report was based on sentiment analysis of over 347,000 tweets.


    What was remarkable about the survey is that North America overwhelmingly prefers Android (yep you read that right) over Apple with Android averaging 32, over Apple 19 in terms of positive sentiment.  Curiously Poland emerged as the world’s number 1 Android hater with 34% of tweets averaging negative.  Latvia ranked as the world’s number one Apple hater with 35% tweets about Apple averaging negative.


    Whatever religious standing consumers hold over either platform the sentiment doesn’t stack up when it comes to B2B and B2B2C mobile apps.  A tally of Apple and Android SDKs for three of the most popular analytics firms Segment, Amplitude and Mixpanel tell a very different story. A sample of Business and Finance apps using SDKs for the aforementioned analytics firms reveal Apple as the clear front runner with almost double the number of SDKs over Android.


    Love or hate when it comes to the question of how users feel the apps they use, analytics will provide some insight however they don’t provide any tools enabling quick response to change or influence user behaviour.   App developers are largely limited to hard coding which extends to any user engagement strategies like mobile app user onboarding tours, product walkthroughs, contextual mobile tooltips, in-app FAQ’s and user surveys.  Darryl Goede, CEO and founder of Sparkbox knows first hand how long and painful software development can be, however being able to use a low-code user engagement platform like Contextual allows his team to quickly respond to changes in user behaviour and maintain the love of Spark Pico users


    React Native shares the love!. At Contextual we are noticing emerging B2B apps are trending towards Android particularly in Asia and South America however what we are also seeing is a preference for React Native for the development of both Android and IOS business apps.  This is great news for Product Teams looking to accelerate their apps across both iOS and Android platforms.  The good news is Contextual provides a simple easy to implement solution for creating and targeting mobile and web application user onboarding guides and walkthroughs and in-app contextual tooltips, FAQs and user surveys across each operating system.

  • The Truth about A/B Testing

    Last Thursday 100+ people crammed into a fireside on Growth and Product.**

    This blog post covers the conundrum of Statistical significance in A/B experiments:

    1. why the size of uplift is important

    2. how much data gives me statistical significance?

    3. how long you have to run an experiment (you will be shocked)

    4. are you better tossing a coin?

    5. what you pick may delay experiment cadence.

    Lets start with this top-level discussion (** with Jordan from Deputy)

    Firstly, here are some links if you are interested in the basics and maths of A/B testing.

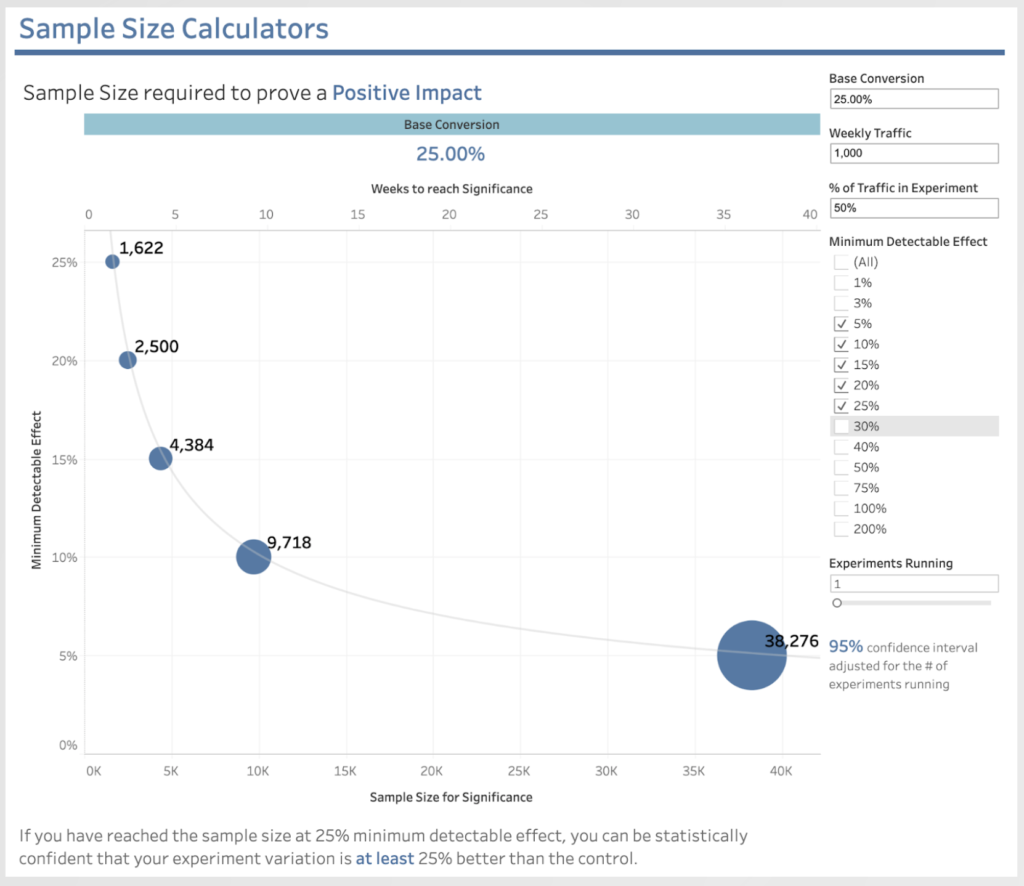
    Jordan illustrated the point with this chart. The curve shows practically even large startups have volume challenges. Even with 1000 customers/week entering a 50:50 A/B test, if you only are looking for 5% uplift on an existing 25% conversion, then you would need to wait 35 weeks for statistical significance!

    Only then can you make a data-driven decision.

    Source: Jordan Lewis, Deputy

    You have a lot of things to agonise over when you are losing prospects in your funnel (whether it be registration, activation or getting a payment) – which elements do you pick? Which fields do you remove (please refer to my earlier Deputy blog post on trialler incentives). So you need to pick your A/B experiments carefully.

    Simply put: Jordan makes the point that you can only run one experiment (on a page/process) until you have a “winner”. Then you can start the second. This means that elapsed time will hamper your productive output (per year) as a Product or Growth team.

    Gut-Data-Gut – There is a wonderful talk from Stanford about how you need to optimise with the expertise and prudence of your team. Because of time constraints:

    A) you MUST make bets on the biggest upward movers of statistical significance.

    B) you MUST make bets on the smallest downward movers of statistical significance if the experiment fails (your failures are NOT glorious).

    Monitoring both impacts is critical to ensure you are converging on the best experiments and not doing damage in the process!

  • Onboarding A/B Tests – the math by example

    In the previous post I ran through why it makes sense to run onboarding experiments and measuring them under an A/B or A/A/B methodology. I stuck to the qualitative principles and didn’t get “into the weeds” of the math. However, I promised to follow up with an explanation of statistical significance for the geek minded.
    Because A/B has been around for a very long time in various “web” fields such as landing page optimisation, email blasts and advertising – this is by far the first, last or most useful. The purpose here is to:

    • tightly couple the running onboarding and educations to a purpose, and that is:
      • Make onboarding less “spray and pray” and head towards more ordered directions of continuous improvement
      • deepen user engagement with your App’s features.
    • Explain the reason why the Contextual Dashboard presents these few metrics rather a zillion pretty charts that don’t do anything other than befuddle your boss.

    In this case, we will consider a simple A/B test (or Champion vs Challenger).

    Confidence for statistical significance

    Back to that statistics lecture again (my 2nd-year engineering statistics class was in evenings and usually preceded by a student’s meal of boiled rice, soy sauce and Guinness (the nutrition element) – so I’ll rely more on Wikipedia than my lecture notes 🙂

    If you think about your A and B experiments, you should get a normal distribution of behaviour – plotting on the chart you get the mean which is the center point of the curve and a population that is plotted either side of the center – yielding a chart like this.

    Confidence Interval is the range of values in a normal distribution than that fit a percentage of the population. In the chart below, 95% of the population is in blue.

    Most commonly the confidence interval of 95% is used, here is what Wikipedia says about 95% and 1.96:

    95% of the area under a normal curve lies within roughly 1.96 standard deviations of the mean, and due to the central limit theorem, this number is therefore used in the construction of approximate 95% confidence intervals.

    The Math by Example

    Let’s take a simple example of an App that is in its default state as the engineers have delivered it, there is a new feature that has been delivered but the Product Manager wants to increase the uptake and engagement of the feature. The goal is to split the audience and measure the uplift of the feature.

    We call the usage of the new feature a “convert” and a 10% conversion rate means that 10% of the total population in the “split matches”.

    CHAMPION

    This is the App’s default state.

    • T = 1000 split matches
    • C = 100 convert (10% conversion rate).
    • 95% range ⇒ 1.96

    The standard error for the champion:

    user onboarding = 1.96 * SQRT(0.1 * (1-0.1) / 1000)= 0.00949

    Standard Error (SE) = 1.96 * 0.00949 = 0.0186

    • C ± SE
    • 10% ± 1.9% = 8.1% to 11.9%

    CHALLENGER:

    This is the App’s default state PLUS the Product Manager’s tip/tour/modal to educate users about this awesome new feature.

    • T = 1000 split matches
    • C = 150 convert (15% conversion rate)
    • 95% range ⇒ 1.96

    SE (challenger)

    user onboarding = 1.96 * SQRT(0.15 * (1-0.15) / 1000)= 0.01129

    Standard Error (SE) =1.96  * 0.01129 *= 0.02213

    • C ± SE
    • 15% ± 2.2% = 12.8% to 17.2%

    Now charting these 2 normal distributions to see the results. Thus, since there is no overlap using the 95%/1.96 confidence, the variation results are accepted as reliable. (I couldn’t figure out how to do the shading for the 95%!)

    In this case you can conclude that the A/B test has succeeded with a clear winner and can be declared as a new champion. If you refer back to the last post, then iteration can be part of your methodology to continuously improve.

    How long should an experiment run?

    Experiments should run to a statistical conclusion, rather than rubbing your chin and saying “lets run it for 3 days” or “lets run it in June” – period based decisions are logical to humans but that has nothing to do with the experiment**.
    So my example above is technically not helpful if the data hadn’t provided a conclusive result – this is argued in a most excellent paper from 2010 by Evan Miller. Vendors of dashboard products like ours can encourage the wrong behaviour by tying the experiment to a time period

    **  except for the behaviour of your human subjects – like your demographic are all on summer holidays