Blog

  • It’s time Product Managers had better onboarding tools

    Product managers are often seen as the CEO of their product who are navigating their way between the business, technology and user experience to deliver, as described by Marty Cagan a product that is “valuable, usable and feasible”.

    That’s a big job!


    Surprisingly, there arn’t really any tools that “nail” that level of responsibility – and we think that’s weird. The most important role in the product organization has to beg, borrow, steal dashboards from other organizational units.

    There are many software tools used by Product Managers to:

    • roadmap planning and communication. (e.g Trello, google spreadsheet???!!!,  Ash Maurya’s Lean Canvas)
    • design of an app and user interface (e.g Invision)
    • execution allow to help them manage and monitor a product teams activities and ensure jobs are done (e.g Jira)
    • measurement (Mixpanel, Google Analytics, Omniture/Adobe)
    • growth hack experiment roadmap (trello again or maybe Sean Ellis’ tools).

    However, there are no tools available to empower a mobile product manager to experiment, measure, iterate the user experience without negotiating priorities on the product roadmap,, scheduling developer tasks and going through a development and release cycle.

    We interviewed over 90 Mobile Product Managers to understand the pain points they are experiencing with mobile user onboarding and here are the common themes:

    Business

    • We are investing in developing new features in our App, but we have no time for user education and our activation rates are low
    • We spend so much money acquiring users only to lose users after download. Our Day Zero churn is huge!
    • We need to drive users to higher-value features to monetize the App.
    • We want to know what features drive high value users.
    • Whats the next-best-step to move a user to higher value segment?

    Technology

    • Any onboarding change I want to make requires me to log a ticket with my busy developers (who are sometimes at an external agency)
    • When I  suggest changes I have to use a team of developers and designers
    • I then have to wait for the new version to be released before I can see results and if I want to make changes I have to start all over again!

    User Experience

    • I want to get my user’s to perform key first actions on download of the App
    • I want to drive actions that create power users
    • I want to segment and target my users with different onboarding flows
    • I want to educate users in real time for the exact user that need it. And not SPAM users who don’t

    So we took this feedback and built:

    1. ability to run experiments INDEPENDENT of product roadmap
    2. zero drain of developer resources
    3. allow connection to backend systems to leverage existing user data in corporate systems
    4. easily measure the effectiveness of experiments with A/B testing.
    5. Build a library of best practice “champions” that match to specific target audiences.
    6. User-level App Analytics that captures the data before you realise you need it – no more event tags!!!
    7. Reports to present to management on uplift and success metrics.

    We think we’ve made a good start on this. Mapping the above Contextual product needs onto the Venn Diagram it looks like:

    Its time that product managers had tools that gave them the control and agility that the business demands from them! If you’ve got ideas for our product roadmap, tweet, click the chat widget or email us!

    Follow us on Twitter: @usepointzi

  • The 4 ways Dating Apps seduce with Progressive Onboarding

    Those of you who have experienced online dating will know quality connections are not easy to find! When a ‘spark” appears there is usually a flurry of messages, one more intimate than the last, as each person progressively disclosures a little bit more about themselves. Some people know the art of progressive disclosure  so well, that they can quickly create a connection that might take months or weeks in the real world!

    If you have used a Dating Apps (even a sneak peek), you will also know that Dating Apps use their own type of progressive disclosure (aka progressive onboarding), to make sure the App becomes extremely habitual.

    So what can Dating Apps teach us about the art of seducing users??

    Progressive Onboarding Tip 1: Create a seducing first-time experience.

    When you download a Dating App like OKCupid or Bumble, the first actions are to login in with your Facebook account, upload a photo and start swiping. These Apps want to bring you to the buzz of “a match” as quickly as possible. There are no busy onboarding carousels describing the product benefits or how to use the App, they know, this all gets in the way of the first time user experience.

    Dating Apps don’t want to overwhelm users with all features and possibilities and prefer to give users “instant gratification”. They make it as easy as possible for the user start swiping, then use progressive disclosure to show uses the more advanced features of the App at a later stage.

    This is how Bumble does it – download, login, swipe!

    progressive onboarding with bumble app

    Even after the first the swipe, you have no idea about the features of the App, what is free or isn’t or how to customise searches or experience. That’s all a mystery at this stage and they just want you to play!

    Progressive Onboarding Tip 2: Only ask users to pay after they have received value

    Progressive disclosure is the best way to show people the basics first. After they understand the core value of the App and are hooked, show them the higher value paid features. Your chance of getting a user to upgrade to paid features is much higher after they have had an awesome first-time experience.

    This is how Bumble asks people to pay for more valuable features.

    The Bumble App, puts women in control, as only women can initiate a conversation with a match. The men cannot start a conversation with a woman, they can only show interest, by liking.  After the female user has achieved some matches and visits her queue, it is then disclosed that she can upgrade her subscription to see everyone that has liked her.

    Very clever and so much cleverer than explaining the paid features upfront, which is a less effective practice that many less mature Apps use.

    This Bumble use case is a great example of disclosing real-time user education about paid features when the user is ready and motivated to hear about them.

    progressive onboarding with bumble dating app

    Progressive Onboarding Tip 3: Let their users loose to learn about the App

    One way to think about progressive disclosure is to only show the information that is relevant to the task that a user wants to focus on. When you think about onboarding in this way, it puts the onboarding journey in the hands of the user rather than the App developers. We call this self-paced onboarding, where the users learn about the App by experiencing the Ap at their own pace.

    Let’s look at another great seducer – OKCupid, and how they get feature activation by showing users how to be more productive in the App.

    In this case, a user after experiencing the App for some time is shown the Search Filter feature. OKCupid has decided to not show this important feature to users in the early stages of their journey. They have opted to delay this piece of user education until the user has been engaged and active for some time, and enjoying the experience of finding matches and chatting with potential dates.

    Segmenting users “who have not used the search function” and presenting a tip to show users where to find the search function, is a great way to provide contextual education. It is simple, relevant and is valuable as it focuses the user on the benefit – save time and find better quality matches.

    progressive onboarding with okcupid dating app

    Progressive Onboarding Tip 4: Help users understand the features they are paying for!

    In the online dating world, everything happens fast. So when a user agrees to pay for access to subscriber features, it’s important they understand what they have access to and how to use the features. Reminding users of the value of features is a strategy used by OKCupid as a way to demonstrate the exclusive benefits of being a subscriber.

    For example, OKCupid paid users, have the benefit of secretly viewing profiles. This means they have the option to let someone know that they showed interest by visiting their page. In this example, education is triggered and targeted to a segment of users – “paid users” who have never performed the “reveal my visit” option.

    Triggering a tip in real-time is so much effective and relevant compared to education outside of the App via email or push notifications that users rarely read. The “Got it” button, also means the OKCupid can measure the effectiveness of the education, and attribute feature usage to an education campaign.

    How can Contextual improve your Apps progressive onboarding?

    In the dating world, progressively disclosing interesting information is so much more attractive than doing a download of your history. The same goes for user onboarding, and the leading Dating Apps show us the art of seduction – giving the user an instant experience of a match, then progressively showing users how to improve their experience over time.

    The Contextual platform makes it super easy for all Apps to have this superpower.  With Contextual, all Apps can create tips, tours and modals to progressively disclose important features to a user without getting in the way of the user’s experience.
    This is all done without code or waiting for an App release.

    Make your App more attractive and:
    – Push feature usage to segments without code
    – Take the guesswork out of feature engagement
    – Avoid having to code for the tip to disappear once the App is open or the user has engaged
    – Get data in and out of the platform with a REST/JSON API and target the right users in real time

  • The Harry Potter Guide to Mobile User Segmentation during Onboarding

    Hogwarts divided their students into four houses: Gryffindor, Hufflepuff, Ravenclaw and Slytherin. These wonderful scenes in the first book and movie were filled with tension because of the angst of Harry avoiding Slytherin and the all-important cementing of the relationships
    Even as an adult if you’ve been to Universal Studio’s Harry Potter rides, you can’t help feeling trepidation when you stand in front of the grumpy looking Sorting Hat.
    mobile user segmentation during onboarding

    So the Sorting Hat does some pretty nifty segmentation based on the student’s characteristic. Just like most of your App users, there is more information that can be deployed to sort the users into specific groups, buckets, houses, audiences or segments!

    “Oh you may not think I’m pretty,
    But don’t judge on what you see,
    I’ll eat myself if you can find
    A smarter hat than me.

    There’s nothing hidden in your head
    The Sorting Hat can’t see,
    So try me on and I will tell you
    Where you ought to be.”

    Most Apps treat mobile user segmentation during onboarding:

    • Not at all.
    • As an after-thought.

    But smart Product Managers know that personalization is key. After all, consider the effect of education or a tour so well targeted, it’s perceived as helpful, rather than an irrelevant interruption to the user’s flow. Personalisation brings extra value to the user so that increased Lifetime Value (LTV) comes naturally.

    The Sorting Hat has unknown, invisible, magical algorithm’s that run, tentatively gauge the users response and adjusts accordingly. In the case of Harry, the hat already knew something about Harry’s provenance and destiny but adapts to the real-time feedback from Harry. This is pretty sophisticated sorting segmentation 🙂

    A simpler example is one that we see commonly.

    The customers of an enterprise App are identified when they login/register, this is the case for banks, telcos, media companies and apps that already have web properties or customer accounts. These companies often have existing information that when connected to a mobile App login can automatically segment the user into a custom onboarding experience:

    • One user is in the Gryffindor segment because they have subscribed to a particular product:
      • For a telco this might be pre-paid cards vs contract. You want to focus the App on (a) exposing relevent functions to this user’s (top-ups) etc. As well, you want to potentially capture them as a Contract customer by offering the latest iPhone-16 as part of the contract. When the user signs up for the contract they shift to the Hufflepuff segment.
      • For a bank this may be a customer who has never used the FX function in the app but transfers money regularly via the website.
    • Another user might be in the Ravenclaw because of their demographic profile including age/gender/country  which makes them. We’ve seen this commonly to provide additional help (tips/tours/modals) in the App to guide them to get jobs done.
    • See Engagement Segments and Value Segments below.

    Without this background a priori information, the user gets a vanilla generic experience and engagement satisfaction requires more work from them.

    Any step towards greater segmented clarity of your user base is a step in the right direction and the Contextual engine automatically collects usage that automatically becomes part of your segmentation options. With more data-driven distinctions, the right actions become more obvious., effective segmentation enhances the entire mobile user experience. And it’s easy to start.

    Customer Segmentation

    Steps to effective mobile user segmentation:

    1. Plan out the “user’s journey”. Identify different stages of the lifecycle and interesting trigger points within this journey
    2. Cluster users into a few preliminary groups (think Gryffindor, Hufflepuff, Ravenclaw and Slytherin):
      • based on a-priori attributes discussed above PLUS
      • usage data from Contextual. Build a persona around these attributes
      • start with just 2 segments, say Slytherin and Hufflepuff, don’t be over-ambitious.
      • How many users are in this segment? How easily does your App speak to this segment.
    3. Run Tips/Tours/Modals to educate the user and set a “success metric” –> Test actions on these personas to drive the success metric. A good idea for a success metric is moving onto the next stage of the user lifecycle or making a purchase or upgrading their plan.
    4. Treat this as an A/B experiment, refer to this post and this post for more detail.
      • Was it successful?
      • Measure the outcomes of the actions by success metric.
    5. ITERATE. Refine mobile user segments, onboarding content, onboarding triggers to continue to improve the outcome. As more data is collected, the actions will become more effective over time
    6. When you find that a certain persona responds consistently well to a certain onboarding experiment, make this your new “champion” (the default way the App behaves).

    The magic in user segmentation

    Segmentation by demographics is not enough. As we gave in the Harry example at the top, his demographics were Slytherin but his behaviour was Gryffindor.

    There are two ways in increase LTV – enhance engagement or encourage monetisation.

    Engagement Segments:

    • How long ago did the user download the app?
    • Are they still an active user?
    • Frequency: How many times is the app opened per week?
    • Duration: How long does the user spend each time?
    • Depth: How many features have the user accessed?

    Value Segments:

    • Status: Are they free, trial or premium subscribers?
    • Recency: How long since the last purchase?
    • Frequency: What is the purchase history? Users who never bought? Bought Once? 2-5 purchases?
    • Value: Have they visited your stores? Have they clicked on in-app ads? What price range are their purchases?

    Actions for segments:

    • Encourage users to move onto the next stage of the lifecycle.
    • Win back customers using the most effective method. If a user downgraded from a premium account within the past week, perhaps targeting them for feedback regarding desired features and giving them a 20% off resubscription offer is effective.
    • Discover how different segments move through different lifecycle stages. Typically for Apps, a small proportion of segments make up the majority of subscriptions or purchases. Which lifecycle stages are users getting stuck?
    • Test the optimum time to ask users to subscribe to the premium model, based on their segment. Are better conversion rates achieved when users are asked the first day they use the app or after a week?
  • Onboarding A/B Tests – the math by example

    In the previous post I ran through why it makes sense to run onboarding experiments and measuring them under an A/B or A/A/B methodology. I stuck to the qualitative principles and didn’t get “into the weeds” of the math. However, I promised to follow up with an explanation of statistical significance for the geek minded.
    Because A/B has been around for a very long time in various “web” fields such as landing page optimisation, email blasts and advertising – this is by far the first, last or most useful. The purpose here is to:

    • tightly couple the running onboarding and educations to a purpose, and that is:
      • Make onboarding less “spray and pray” and head towards more ordered directions of continuous improvement
      • deepen user engagement with your App’s features.
    • Explain the reason why the Contextual Dashboard presents these few metrics rather a zillion pretty charts that don’t do anything other than befuddle your boss.

    In this case, we will consider a simple A/B test (or Champion vs Challenger).

    Confidence for statistical significance

    Back to that statistics lecture again (my 2nd-year engineering statistics class was in evenings and usually preceded by a student’s meal of boiled rice, soy sauce and Guinness (the nutrition element) – so I’ll rely more on Wikipedia than my lecture notes 🙂

    If you think about your A and B experiments, you should get a normal distribution of behaviour – plotting on the chart you get the mean which is the center point of the curve and a population that is plotted either side of the center – yielding a chart like this.

    Confidence Interval is the range of values in a normal distribution than that fit a percentage of the population. In the chart below, 95% of the population is in blue.

    Most commonly the confidence interval of 95% is used, here is what Wikipedia says about 95% and 1.96:

    95% of the area under a normal curve lies within roughly 1.96 standard deviations of the mean, and due to the central limit theorem, this number is therefore used in the construction of approximate 95% confidence intervals.

    The Math by Example

    Let’s take a simple example of an App that is in its default state as the engineers have delivered it, there is a new feature that has been delivered but the Product Manager wants to increase the uptake and engagement of the feature. The goal is to split the audience and measure the uplift of the feature.

    We call the usage of the new feature a “convert” and a 10% conversion rate means that 10% of the total population in the “split matches”.

    CHAMPION

    This is the App’s default state.

    • T = 1000 split matches
    • C = 100 convert (10% conversion rate).
    • 95% range ⇒ 1.96

    The standard error for the champion:

    user onboarding = 1.96 * SQRT(0.1 * (1-0.1) / 1000)= 0.00949

    Standard Error (SE) = 1.96 * 0.00949 = 0.0186

    • C ± SE
    • 10% ± 1.9% = 8.1% to 11.9%

    CHALLENGER:

    This is the App’s default state PLUS the Product Manager’s tip/tour/modal to educate users about this awesome new feature.

    • T = 1000 split matches
    • C = 150 convert (15% conversion rate)
    • 95% range ⇒ 1.96

    SE (challenger)

    user onboarding = 1.96 * SQRT(0.15 * (1-0.15) / 1000)= 0.01129

    Standard Error (SE) =1.96  * 0.01129 *= 0.02213

    • C ± SE
    • 15% ± 2.2% = 12.8% to 17.2%

    Now charting these 2 normal distributions to see the results. Thus, since there is no overlap using the 95%/1.96 confidence, the variation results are accepted as reliable. (I couldn’t figure out how to do the shading for the 95%!)

    In this case you can conclude that the A/B test has succeeded with a clear winner and can be declared as a new champion. If you refer back to the last post, then iteration can be part of your methodology to continuously improve.

    How long should an experiment run?

    Experiments should run to a statistical conclusion, rather than rubbing your chin and saying “lets run it for 3 days” or “lets run it in June” – period based decisions are logical to humans but that has nothing to do with the experiment**.
    So my example above is technically not helpful if the data hadn’t provided a conclusive result – this is argued in a most excellent paper from 2010 by Evan Miller. Vendors of dashboard products like ours can encourage the wrong behaviour by tying the experiment to a time period

    **  except for the behaviour of your human subjects – like your demographic are all on summer holidays

  • Mobile Onboarding A/B testing simply explained

    In earlier posts about Google’s and Twitter’s onboarding tips we mentioned they would absolutely be measuring the impact of Tips and Tours to get the maximum uplift of user understanding and engagement.

    One method is just by simply looking at your analytics and checking the click-thru rate or whatever other CTA (call-to-action) outcome you desired. But 2 big questions loom:

    1. Is what I’m doing going to be a better experience for users?
    2. How do you “continuously improve?

    In recent years – rather than a “spray and pray” approach, it’s favorable to test-and-learn on a subset of your users. Facebook famously run many experiments per day and because their audience size and demographic diversity is massive they can “continuously improve” to killer engagement. If they “burn a few people” along the way its marginal collateral damage in the execution of their bigger goals.

    That sounds mercenary but the “greater-good” is that by learning effectiveness of your experiments will result in better user experiences across the entire user-base and more retained users.

    What do I mean by Mobile Onboarding?

    Onboarding is the early phases of a user’s experience with your App. A wise Product Manager recently said to me “on-boarding doesn’t make a product… …but it can break the product”.

    If you are familiar with Dave McClure’s “startup metrics for pirates” – then the goal of Onboarding is to get the user to the “AR” in “AARRR”. To recap:

    • A – Acquisition
    • A – Activation
    • R – Retention
    • R – Referral
    • R – Revenue

    So Onboarding’s “job” is to get a user Activated and Retended or Retentioned (can I make those words up? OK, OK “Retained”).

    Because a user’s attention-span is slightly worse than a goldfish your best shot is to get the user Activated in the 1st visit. Once they are gone, they may forget you and move onto other tasks.

    Yes – but specifically what do you mean by Onboarding?

    Activation is learning how a user gets to the “ah-ha” moment and cognizes your Apps utility into their “problem solving” model. Specific actions on onboarding are:

    • Get them some instant gratification
    • Get them some more instant gratification
    • Trade some gratification for a favour in return
      • User registration
      • Invite a friend
      • Push notification permission
    • Most importantly it is the education and execution of a task in the App that gets the “ah-ha” moment. This is often:
      • Carousels
      • Tips
      • Tours
      • Coachmarks
      • A guided set of tasks

    Progressive (or Feature) Onboarding

    Any App typically has more than one feature. Many retailers, banks, insurers, real-estate, telcos (and others) have Apps that have multiple nuggets of utility built into the App.

    This is because they have a deep, varied relationship with their customers and multiple features all need to be onboarded. We can’t decide what to call this yet – its “feature” driven – but the goal is to progressively deepen a user’s understanding and extracted value from the App.

    So onboarding (and A/B testing) applies to more than the first “activation” stage of the App.

    What is A/B testing?

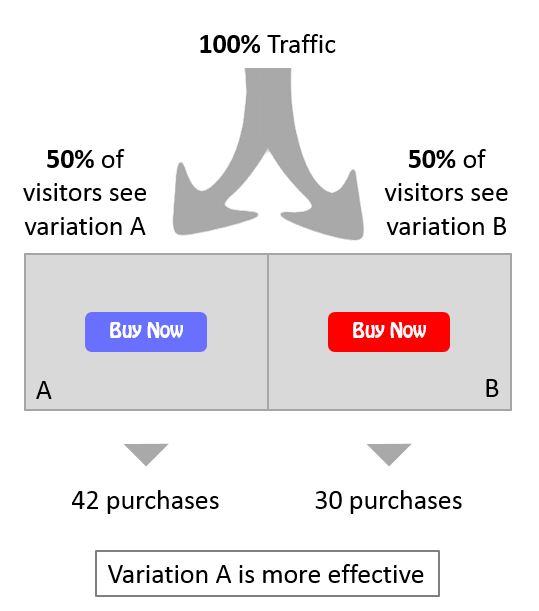
    A/B testing, or split testing, are simple experiments to determine which option, A or B, produces a better outcome. It observes the effect of changing a single element, such as the presenting a Tip or Tour to educate a user.

    Champion vs Challenger

    When the process of experimentation is ongoing, the process is known as champion/challenger. The current champion is tested against new challengers to continuously improve the outcome. This is how Contextual allows you to run experiments on an ongoing basis so you can continue to improve your Activation.

    A/B Testing Process

    Step 1: Form a hypothesis around a question you would like to test. The “split” above  might be testing an experiment (based on a hypothesis) that running a Tip or Tour will influence a “Success Metric” of “Purchases”.

    The “Success Metric” does not need to be something so obvious, it may be testing the effectiveness of an experiment to alter “times opened in last 7 days” across the sample population.

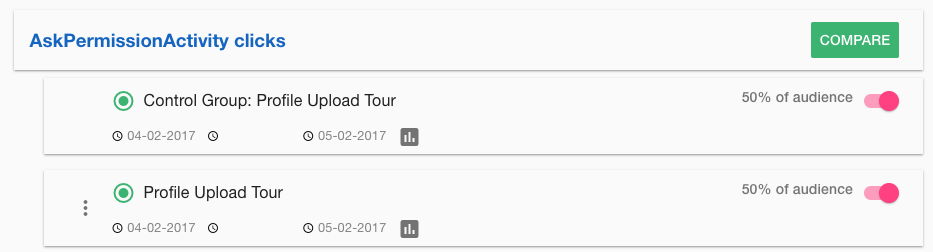
    Here’s another example teaching a user how to update their profile and add a selfie.

    Step 2: Know you need statistical significance (or confidence). See the section below on this – it’s a bit statistical but in summary the certainty you want that the outcome of your experiment reflects the truth. Do not simply compare absolute numbers unless the two numbers are so different that you can be sure just by looking at them, such as a difference in conversion rate between 20% and 35%.

    Step 3: Collect enough data to test your hypothesis. With more subtle variations under experiment, more data needs to be collected to make an unambiguous distinction of statistical confidence decided in Step 2.

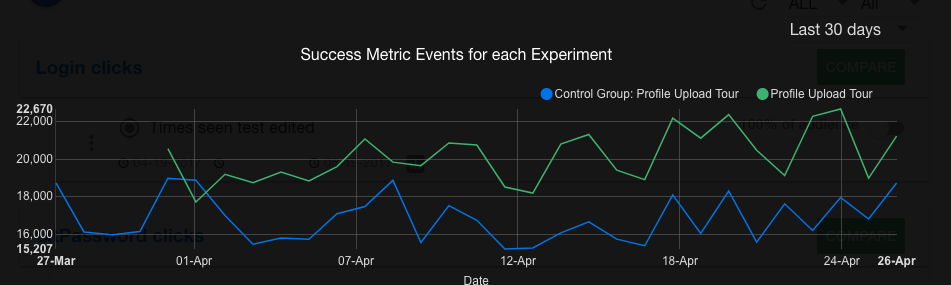
    Step 4: Analyse the data to draw conclusions. Contextual provides you with the comparison of performance for every campaign grouped by the same “success metric”. The chart below shows the:

    • Blue is the Control Group (Champion)
    • Green is your Experiment  (Challenger)
    • The last 30 days history.

    “Contextual automatically captures screen visits and button clicks without you needing to a-priori think about it”

    Iterate

    Step 5: Build from the conclusions to continue further experiment iterations.

    Sometimes this might mean:

    • Declaring a  new “Champion”
    • Refining a new “Challenger”
    • Or scrapping the hypothesis.

    The most impressive results come from having a culture of ongoing experiments. It will take some time but ultimately the Product Manager can recruit others in their team (developers, QA, growth hackers) to propose other experiments.

    Statistical Significance

    Picking the right metric

    Running experiments are only useful if:

    • You selected the correct “Success Metric” to examine. In Contextual we allow you to automatically chart your “Success Metrics” comparisons, but we also allow you to “what-if” other metrics. Contextual:
    • automatically captures screen visits and button clicks without you needing to a-priori think about it.
    • allows you to sync data from your backend systems so you can measure other out-of-band data like purchases or loyalty points etc.

    A/A/B or A/A/B/B Testing

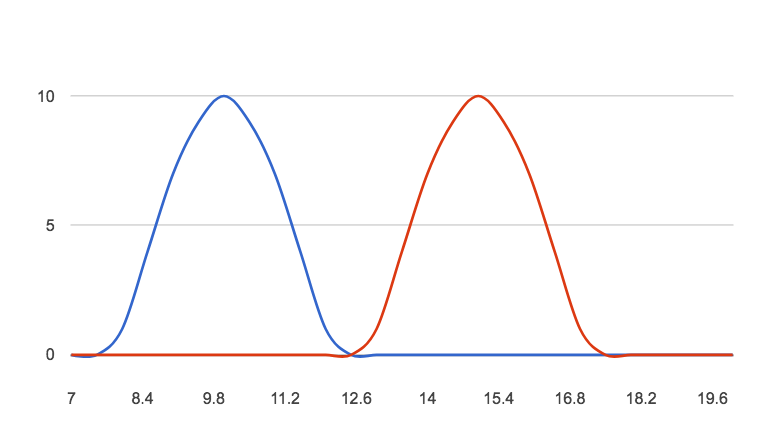
    It has become more common to also duplicate identical running of an experiment to eliminate any question of statistical biasing using the A/B tool. If there is a variation between A–A or B/B is “statistically significant” then the experiment is invalidated and reject the experiment.

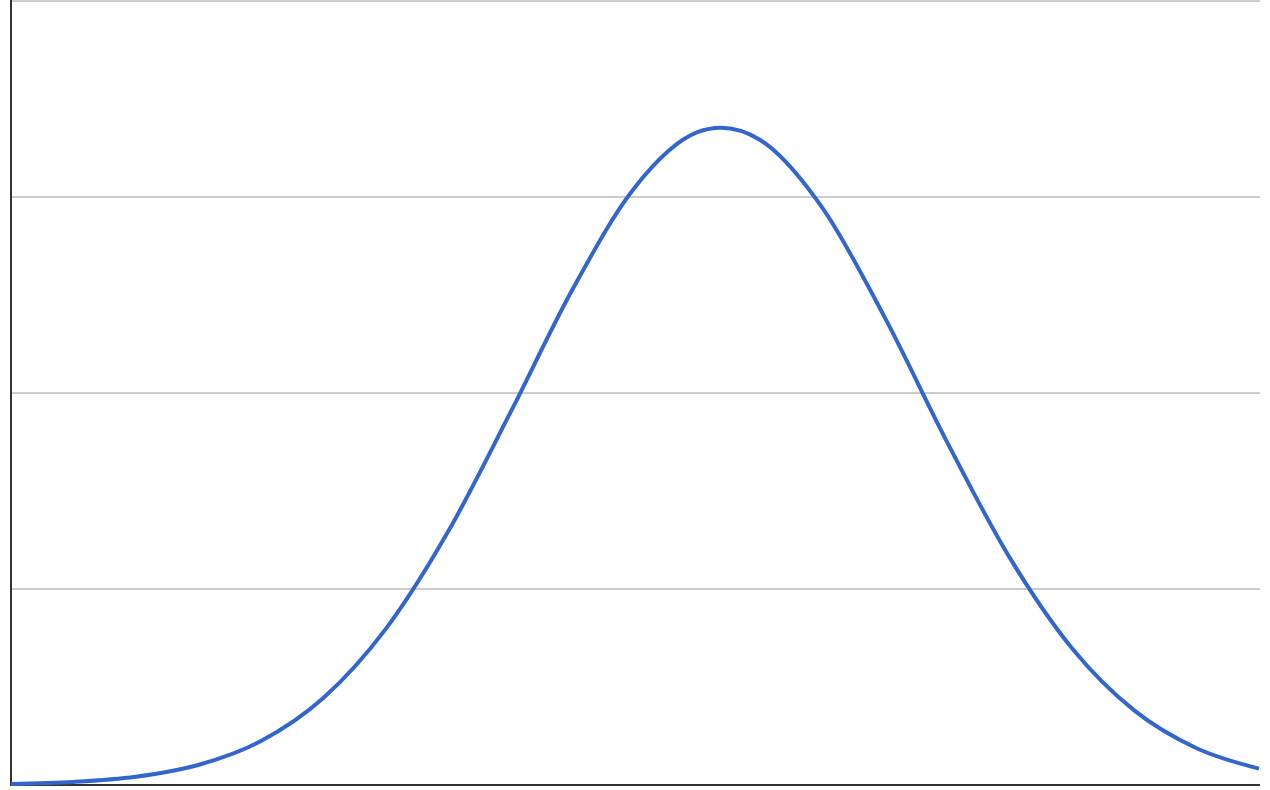
    Sample Size and Significance

    If you toss a coin 2 times its a lousy experiment.  There is an awesome Derren Brown “10 heads in a row” show. Here’s the spoiler video! If you remember back to your statistics classes at College/University the “standard error” (not “standard deviation”) of both A and B need to NOT overlap in order to have significance.

    Where T = test group count and C = converts count and 95% range is 1.96, Standard Error is:

    I’ll do a whole separate post on it for the geeks but using a calculator in the product is good enough for mortals 🙂
    UPDATE: The geek post is here!

    A/B testing vs multivariate testing

    A/A/B is a form of multivariate testing. But multivariate testing is a usually a more complicated form of experimentation that tests changes to several elements of a single page or action at the same time. One example would be testing changes to the colour scheme, picture used and the title font of a landing page.

    The main advantage is being able to see how changes in different elements interact with each other. It is easier to determine the most effective combination of elements using multivariate testing. This whole picture view also allows smaller elements to be tested than A/B testing, since these are more likely to be affected by other components.

    However, since testing multiple variables at once splits up the traffic stream, only sites with substantial amounts of daily traffic are able to conduct meaningful multivariate testing within a reasonable time frame. Each combination of variables must be separated out. For example, if you are testing changes to the colour, font and shape of a call to action button at the same time, each with two options, this results in 8 combinations (2 x 2 x 2) that must be tested at the same time.

    Generally, A/B testing is a better option because of its simplicity in design, implementation and analysis

    Summary

    Experiments can be “spray-and-pray” or they can be run with a discipline that provides statistical certaintly. I’m not saying its an essential step and the ONLY metric you want to apply to your App engagement – but as tools become available to make this testing possible you have the foundations to make it part of you culture.