Category: A/B Testing

  • How Much Feedback is Enough Feedback?

    How Much Feedback is Enough Feedback?

    An essential component for a well-oiled machine that is a product-led company is feedback. It’s a tool that can help better your product, build meaningful connections with your users, and help you run a successful business.

    But do you need a large quantity of feedback to translate it into valuable product improvements? Is any feedback a good enough lead to make changes? Does context matter?

    This article will give some answers regarding realistic response rates, justifying changes based on feedback, and much more. So, let’s dive in!

    Realistic Response Rates in Context

    The concept of a response rate indicates the percentage of the users who offer feedback for your product, a feature of it, or the business in general. However, as we already know, feedback is contextual.

    According to Survey Any Place, the average feedback response rate is 33%. The infographic shows the impact different mediums have on giving feedback. In contrast with the average rate throughout all feedback channels, a good NPS response rate is anything above 20%.

    This goes to show that you should take into consideration the chosen feedback method when looking at response rates. It might be good practice to combine different ways of asking for feedback for optimal results.

    Another thing you shouldn’t forget is that apps inevitably reach different types of people. This means that you can target your audience with different methods of feedback collecting as well. Diversify your feedback mediums for:

    • Web and Mobile users
    • Different user segments or user roles
    • Different stages of a user journey

    Try different methods for these and see what brings the best results – based on your OKR and JTBD of course! 🙂

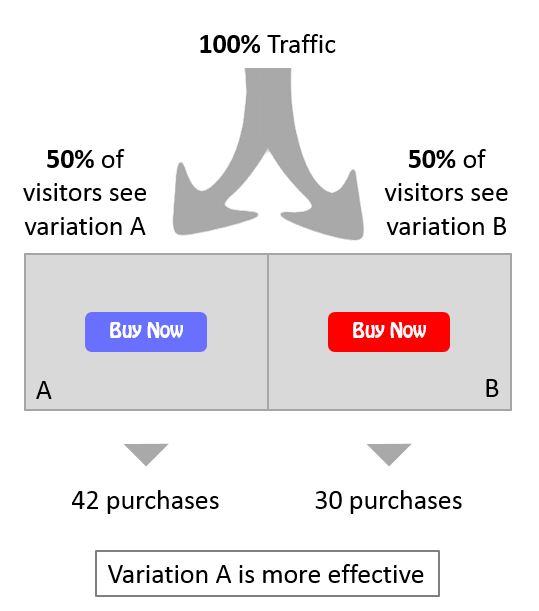
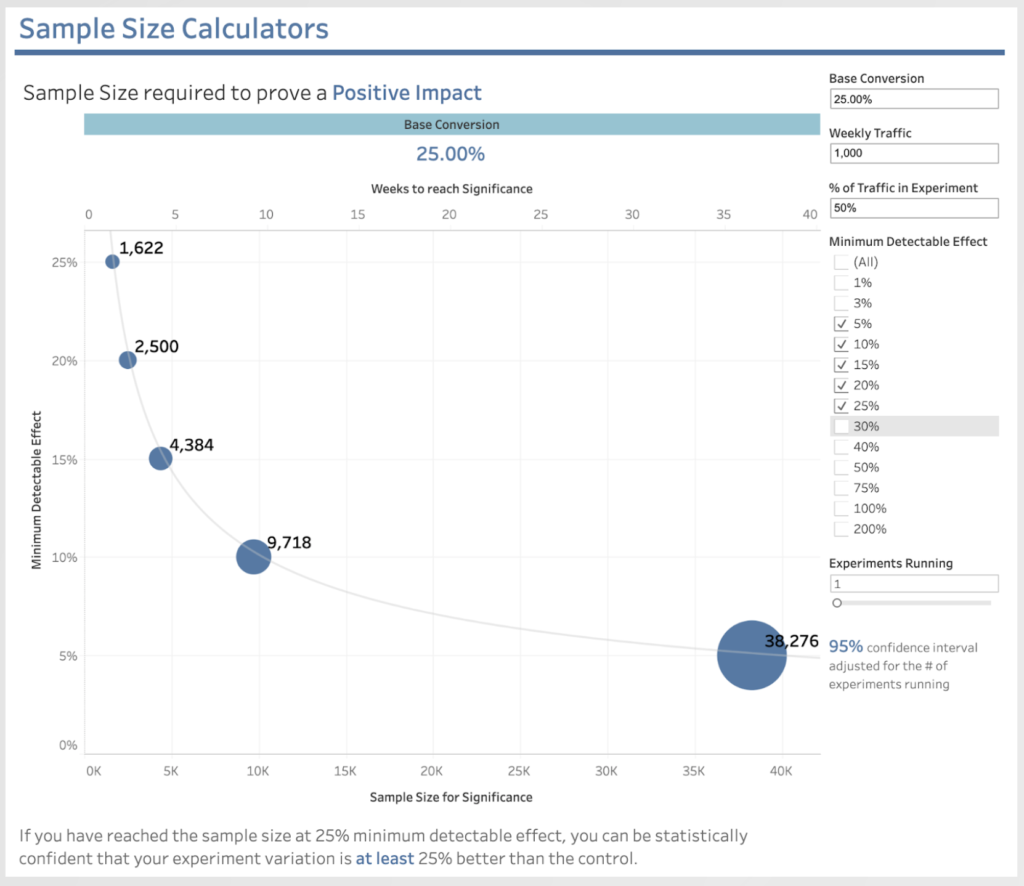
    If you have a large sample of feedback (see these articles on statistical significance)  consider A/B testing to determine what medium (mobile or web) of feedback are your users most comfortable with. This means that you give half of the target audience of users one form of feedback, while the other half are offered a different channel to express their opinion on your product. See which method is more successful in attracting your clients’ opinions and go from there.

    There is no “one size fits all” when it comes to feedback. Figure out slowly what works for you and your users best!

    Justifying Change Based on Feedback

    As part of a product-led company, you probably already know that every piece of feedback is valuable. User feedback fills the gap between your expectations and the user experience.  So, reviews are a testament to your efforts and also a great opportunity to improve your product where it is necessary.

    With that being said, when does feedback justify change?

    Surely, one negative comment or response is not something you, as part of a product-led company, should be discouraged by. However, in the next user journey mapping session, you can take a look at the user’s point of view and the reason behind their negative review. While a single piece of negative feedback is not a strong enough reason to implement significant changes, analyzing it might be a good idea for future developments of your product.

    Statistically, change can be justified with just a 20% feedback rate. As response rates are, on average, around 33%, it’s safe to assume that most users who are willing to offer feedback for your app, fall into that 20%.

    With their help, you can identify product improvement areas and plan your next user journey mapping according to the feedback you are getting. If you are able to incorporate feedback and change, your business is in the ideal market-fit bracket.

    Not Receiving Enough Feedback

    Positive feedback is desired, negative feedback can be a good lesson. But what if there is little to no feedback? If you’re a small startup with under 1000 users, you might find it difficult to get the reviews you need to justify changes or even keep your company running.

    In this case, you should especially focus on implementing in-app feedback methods to ensure that you’re reaching your active and engaged users. Their feedback is the most valuable one when you’re working on a smaller scale. Of course, don’t forget about timing, as it is a significant component of feedback. Give your users enough time to experience your app before asking for their opinion.

    Implementing changes with little feedback to back you up can be a risky business, but it can also drive users to give an assessment. It would be wise to start small when it comes to changes. Test the waters, see what triggers responses from your users.

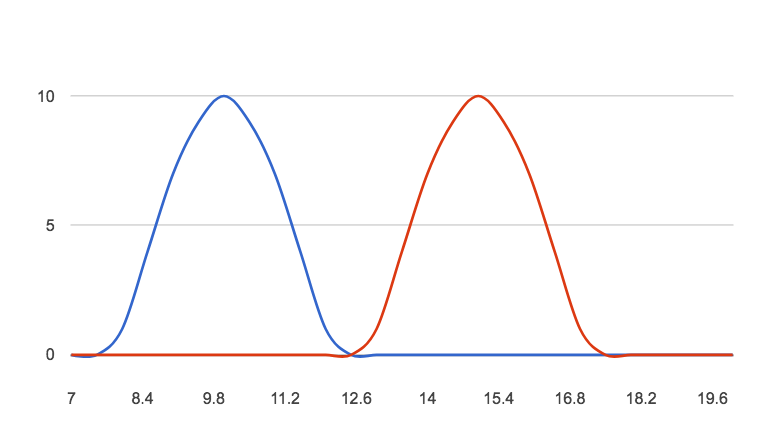
    We mentioned A/B testing earlier in the article. Statistical significance plays an important role in this experiment, and it’s based on a cause-effect relationship. A good example of A/B testing is changing the color of a button within your app. (It can be the button in your in-app feedback survey!).
    Which version drives better response rates from your users? Statistical significance can back you up and give you confidence that the changes you want to implement are positive ones, so that in lieu of enough feedback, you can still make smart moves to improve your app.
    Monitoring the impacts of the changes you make is critical to ensure that you’re not doing damage to your app in the process.

    The Next Steps

    Feedback has an integral part in a successful software business. At Contextual, we can help your journey towards product adoption easier by focusing not only on capturing feedback, but also on onboarding, feature discovery, and much more. Book a demo with us today to learn more!Image Credit

  • Product Managers: Data-driven experiments are an excuse not to be brave

    Product Managers: Data-driven experiments are an excuse not to be brave

    Being “data-driven” is “virtual signalling for Product Managers” and not the best method for some product decisions and roles.

    This snippet from a longer conversation with Patrick Collins of Zip.co digs into the suprising insight of different traits in PMs.

    Patrick quipped about his experience: “I’ve only been doing this product thing for 10 or 15 years”. 

    So it’s clear he has a wealth of experience and carries a lot of lessons and scars from both web and mobile products.

    Patrick’s advice to aspiring and existing Product Managers is to know which type you are:

    1. Analytical
    2. Intuitive and/or creative.
    3. Technical

    In recent years he’s seen migration from Project Management and Business Analyst roles into Product Management. Also there is often a progression from developers into the PM track. But perhaps these new PMs are more analytical and don’t carry a sense of what a great user experience is like.

    The concern is that:

    “experimentation and being data driven,
    can be a cheap out for being brave”. 

    In other words a Product Manager who has the courage to make big bets based on solid user experience background is invaluable in creating a “generational leap” in product quality.

    Patrick notes that this trait is not based on seniority, its really that many PMs are risk adverse. They get into a process of “polishing the turd”.

    It’s an interesting conundrum, in other posts we’ve noted the time expense of A/B tests to get statistical significance, the challenge of PMs wearing many hats and personality traits.

    “But the idea that we can just test our way out of every problem is dangerous because it can really hold a product back.”

    Like most human skills, its part-art and part science. Patrick says:  “I still haven’t quite cracked the formula for what kinds of PM is able to know when to stop polishing and know when to go for a generational leap.”

    “some being more creative, some being more analytical and some being more technical and knowing who you are”

    ref: https://www.linkedin.com/pulse/types-product-managers-animal-kingdom-gaurav-rajan/

    The standard 3-legged stool for PMs is to balance UX, Tech, Business – you may have seen the Venn Diagram in other posts on this blog.

    But the image above illustrated the best fit for PM’s who are pre-disposed to traits of “Technologist”, “Generalist” and “Business-oriented” – the Focus field is a clue as to the persons strengths and weaknesses and ultimately what would be the right product-component for them to work on.

    Digging deeper into the downside of being too analytical, the obvious A/B problem arises:

    “The experimentation culture, I think is damaging in some ways, because it comes across as this kind of analytical thing that that you can test your way out of anything. But it’s like, well, what the hell are you going to test? And how are you coming up with that?”

    If you want to hear more from Patrick on a broad range of topics and experience, join me for our WFH Fireside chat this coming thursday. If you can’t make it, sign up to the blog and it will be in the upcoming posts.

    A note about the cover cartoon

    I was wondering about what picture to put up the top of the post. Perhaps “fork-in-the-road” to reflect product management career choices. Perhaps an “all-in-bet” pic from a casino etc.

    But I actually found a post on Basecamp’s site under their ShapeUp series that captures part of what Patrick was covering. 

    Basecamp are often controvesial, always counter-trend and very, very authentic. This series says:

    Shapeup is Shape Up is for product development teams who struggle to ship. Full of eye-opening insights, Shape Up will help you break free of “best practices” that aren’t working, think deeper about the right problems, and start shipping meaningful projects.

    and that sounds pretty bloody good to me – I’m adding it to my reading list.

    The image came from:  https://basecamp.com/shapeup/2.1-chapter-07

    Transcript

    Patrick Collins 0:03
    Learning of the different kinds of product managers, some being more creative, some being more analytical and some being more technical and knowing who you are. And therefore what if you know i’d imagine the audience is probably going to be aspiring PMs, some of them anyway. knowing who you are as a PM really will help.

    Patrick Collins 0:27
    And you don’t want to be a creative PM, running the platform services team, or tech or a technical PM running the onboarding project for the app, right?

    David Jones 0:40
    Why was it specifically what did you learn that specifically at Moveweb?

    Patrick Collins 0:44
    I guess I’ve learned over both of these past roles, that those different PMs can actually fail in one role and succeed and I don’t mean outright fail, like crashing and burn. I mean succeed in other ones. And so when I look for PMS, I look carefully at their background. And I look at what skills they have. And that will lean me slightly towards where I think they’re probably going to succeed as PM. Creative requires you to take some bold steps. And I think the experimentation culture, I think is damaging in some ways, because it comes across as this kind of analytical thing that that you can test your way out of anything. But it’s like, What the hell are you going to test and how are you coming up with that? Which part and you know, I think I’m on consumer app in particular, it requires a lot of bravery and a lot of courage to translate what you’re hearing from customers into a point of view, and then go test that and having that having that courage to translate data analytics and and customer interview data into into a point of view: not many PMS have that.

    Patrick Collins 2:03
    And it’s actually not a seniority thing I’ve noticed it’s a, it’s a risk taking trait that some PMs just will never get.

    David Jones 2:12
    So just to, just to play that back to you, if I’m a really good data centric type product manager, there was a Stanford saw talk I saw which was called “gut, data, gut”, which was that you’ve got to start with an intuition first, then you can go and get the data to support it or actually run and experiment for that data, then you actually have a new iteration. Are you saying that an analytic type product manager really just misses that sort of “gut” type thing and testing many different sorts of things?

    Patrick Collins 2:44
    CAN. Yeah, I think the concept of experimentation and being data driven, can be a cheap out for being brave and not taking not making courageous leaps on the product and maybe polishing a turd, so to speak. And so sure, I think there’s a really difficult line to walk between knowing when to polish and knowing when to try to “go for it”, like a generational leap. And it’s still kind of I’ve only been doing this product thing for 10 or 15 years now, I still haven’t quite cracked the formula for what kinds of PM is able to know when to stop polishing and know when to go for a generational leap. That’s that’s a really challenging, challenging problem for most PMs. But the idea that we can just test our way out of every problem is dangerous because it can really hold a product back.

  • The Truth about A/B Testing

    Last Thursday 100+ people crammed into a fireside on Growth and Product.**

    This blog post covers the conundrum of Statistical significance in A/B experiments:

    1. why the size of uplift is important

    2. how much data gives me statistical significance?

    3. how long you have to run an experiment (you will be shocked)

    4. are you better tossing a coin?

    5. what you pick may delay experiment cadence.

    Lets start with this top-level discussion (** with Jordan from Deputy)

    Firstly, here are some links if you are interested in the basics and maths of A/B testing.

    Jordan illustrated the point with this chart. The curve shows practically even large startups have volume challenges. Even with 1000 customers/week entering a 50:50 A/B test, if you only are looking for 5% uplift on an existing 25% conversion, then you would need to wait 35 weeks for statistical significance!

    Only then can you make a data-driven decision.

    Source: Jordan Lewis, Deputy

    You have a lot of things to agonise over when you are losing prospects in your funnel (whether it be registration, activation or getting a payment) – which elements do you pick? Which fields do you remove (please refer to my earlier Deputy blog post on trialler incentives). So you need to pick your A/B experiments carefully.

    Simply put: Jordan makes the point that you can only run one experiment (on a page/process) until you have a “winner”. Then you can start the second. This means that elapsed time will hamper your productive output (per year) as a Product or Growth team.

    Gut-Data-Gut – There is a wonderful talk from Stanford about how you need to optimise with the expertise and prudence of your team. Because of time constraints:

    A) you MUST make bets on the biggest upward movers of statistical significance.

    B) you MUST make bets on the smallest downward movers of statistical significance if the experiment fails (your failures are NOT glorious).

    Monitoring both impacts is critical to ensure you are converging on the best experiments and not doing damage in the process!

  • Onboarding A/B Tests – the math by example

    In the previous post I ran through why it makes sense to run onboarding experiments and measuring them under an A/B or A/A/B methodology. I stuck to the qualitative principles and didn’t get “into the weeds” of the math. However, I promised to follow up with an explanation of statistical significance for the geek minded.
    Because A/B has been around for a very long time in various “web” fields such as landing page optimisation, email blasts and advertising – this is by far the first, last or most useful. The purpose here is to:

    • tightly couple the running onboarding and educations to a purpose, and that is:
      • Make onboarding less “spray and pray” and head towards more ordered directions of continuous improvement
      • deepen user engagement with your App’s features.
    • Explain the reason why the Contextual Dashboard presents these few metrics rather a zillion pretty charts that don’t do anything other than befuddle your boss.

    In this case, we will consider a simple A/B test (or Champion vs Challenger).

    Confidence for statistical significance

    Back to that statistics lecture again (my 2nd-year engineering statistics class was in evenings and usually preceded by a student’s meal of boiled rice, soy sauce and Guinness (the nutrition element) – so I’ll rely more on Wikipedia than my lecture notes 🙂

    If you think about your A and B experiments, you should get a normal distribution of behaviour – plotting on the chart you get the mean which is the center point of the curve and a population that is plotted either side of the center – yielding a chart like this.

    Confidence Interval is the range of values in a normal distribution than that fit a percentage of the population. In the chart below, 95% of the population is in blue.

    Most commonly the confidence interval of 95% is used, here is what Wikipedia says about 95% and 1.96:

    95% of the area under a normal curve lies within roughly 1.96 standard deviations of the mean, and due to the central limit theorem, this number is therefore used in the construction of approximate 95% confidence intervals.

    The Math by Example

    Let’s take a simple example of an App that is in its default state as the engineers have delivered it, there is a new feature that has been delivered but the Product Manager wants to increase the uptake and engagement of the feature. The goal is to split the audience and measure the uplift of the feature.

    We call the usage of the new feature a “convert” and a 10% conversion rate means that 10% of the total population in the “split matches”.

    CHAMPION

    This is the App’s default state.

    • T = 1000 split matches
    • C = 100 convert (10% conversion rate).
    • 95% range ⇒ 1.96

    The standard error for the champion:

    user onboarding = 1.96 * SQRT(0.1 * (1-0.1) / 1000)= 0.00949

    Standard Error (SE) = 1.96 * 0.00949 = 0.0186

    • C ± SE
    • 10% ± 1.9% = 8.1% to 11.9%

    CHALLENGER:

    This is the App’s default state PLUS the Product Manager’s tip/tour/modal to educate users about this awesome new feature.

    • T = 1000 split matches
    • C = 150 convert (15% conversion rate)
    • 95% range ⇒ 1.96

    SE (challenger)

    user onboarding = 1.96 * SQRT(0.15 * (1-0.15) / 1000)= 0.01129

    Standard Error (SE) =1.96  * 0.01129 *= 0.02213

    • C ± SE
    • 15% ± 2.2% = 12.8% to 17.2%

    Now charting these 2 normal distributions to see the results. Thus, since there is no overlap using the 95%/1.96 confidence, the variation results are accepted as reliable. (I couldn’t figure out how to do the shading for the 95%!)

    In this case you can conclude that the A/B test has succeeded with a clear winner and can be declared as a new champion. If you refer back to the last post, then iteration can be part of your methodology to continuously improve.

    How long should an experiment run?

    Experiments should run to a statistical conclusion, rather than rubbing your chin and saying “lets run it for 3 days” or “lets run it in June” – period based decisions are logical to humans but that has nothing to do with the experiment**.
    So my example above is technically not helpful if the data hadn’t provided a conclusive result – this is argued in a most excellent paper from 2010 by Evan Miller. Vendors of dashboard products like ours can encourage the wrong behaviour by tying the experiment to a time period

    **  except for the behaviour of your human subjects – like your demographic are all on summer holidays

  • Mobile Onboarding A/B testing simply explained

    In earlier posts about Google’s and Twitter’s onboarding tips we mentioned they would absolutely be measuring the impact of Tips and Tours to get the maximum uplift of user understanding and engagement.

    One method is just by simply looking at your analytics and checking the click-thru rate or whatever other CTA (call-to-action) outcome you desired. But 2 big questions loom:

    1. Is what I’m doing going to be a better experience for users?
    2. How do you “continuously improve?

    In recent years – rather than a “spray and pray” approach, it’s favorable to test-and-learn on a subset of your users. Facebook famously run many experiments per day and because their audience size and demographic diversity is massive they can “continuously improve” to killer engagement. If they “burn a few people” along the way its marginal collateral damage in the execution of their bigger goals.

    That sounds mercenary but the “greater-good” is that by learning effectiveness of your experiments will result in better user experiences across the entire user-base and more retained users.

    What do I mean by Mobile Onboarding?

    Onboarding is the early phases of a user’s experience with your App. A wise Product Manager recently said to me “on-boarding doesn’t make a product… …but it can break the product”.

    If you are familiar with Dave McClure’s “startup metrics for pirates” – then the goal of Onboarding is to get the user to the “AR” in “AARRR”. To recap:

    • A – Acquisition
    • A – Activation
    • R – Retention
    • R – Referral
    • R – Revenue

    So Onboarding’s “job” is to get a user Activated and Retended or Retentioned (can I make those words up? OK, OK “Retained”).

    Because a user’s attention-span is slightly worse than a goldfish your best shot is to get the user Activated in the 1st visit. Once they are gone, they may forget you and move onto other tasks.

    Yes – but specifically what do you mean by Onboarding?

    Activation is learning how a user gets to the “ah-ha” moment and cognizes your Apps utility into their “problem solving” model. Specific actions on onboarding are:

    • Get them some instant gratification
    • Get them some more instant gratification
    • Trade some gratification for a favour in return
      • User registration
      • Invite a friend
      • Push notification permission
    • Most importantly it is the education and execution of a task in the App that gets the “ah-ha” moment. This is often:
      • Carousels
      • Tips
      • Tours
      • Coachmarks
      • A guided set of tasks

    Progressive (or Feature) Onboarding

    Any App typically has more than one feature. Many retailers, banks, insurers, real-estate, telcos (and others) have Apps that have multiple nuggets of utility built into the App.

    This is because they have a deep, varied relationship with their customers and multiple features all need to be onboarded. We can’t decide what to call this yet – its “feature” driven – but the goal is to progressively deepen a user’s understanding and extracted value from the App.

    So onboarding (and A/B testing) applies to more than the first “activation” stage of the App.

    What is A/B testing?

    A/B testing, or split testing, are simple experiments to determine which option, A or B, produces a better outcome. It observes the effect of changing a single element, such as the presenting a Tip or Tour to educate a user.

    Champion vs Challenger

    When the process of experimentation is ongoing, the process is known as champion/challenger. The current champion is tested against new challengers to continuously improve the outcome. This is how Contextual allows you to run experiments on an ongoing basis so you can continue to improve your Activation.

    A/B Testing Process

    Step 1: Form a hypothesis around a question you would like to test. The “split” above  might be testing an experiment (based on a hypothesis) that running a Tip or Tour will influence a “Success Metric” of “Purchases”.

    The “Success Metric” does not need to be something so obvious, it may be testing the effectiveness of an experiment to alter “times opened in last 7 days” across the sample population.

    Here’s another example teaching a user how to update their profile and add a selfie.

    Step 2: Know you need statistical significance (or confidence). See the section below on this – it’s a bit statistical but in summary the certainty you want that the outcome of your experiment reflects the truth. Do not simply compare absolute numbers unless the two numbers are so different that you can be sure just by looking at them, such as a difference in conversion rate between 20% and 35%.

    Step 3: Collect enough data to test your hypothesis. With more subtle variations under experiment, more data needs to be collected to make an unambiguous distinction of statistical confidence decided in Step 2.

    Step 4: Analyse the data to draw conclusions. Contextual provides you with the comparison of performance for every campaign grouped by the same “success metric”. The chart below shows the:

    • Blue is the Control Group (Champion)
    • Green is your Experiment  (Challenger)
    • The last 30 days history.

    “Contextual automatically captures screen visits and button clicks without you needing to a-priori think about it”

    Iterate

    Step 5: Build from the conclusions to continue further experiment iterations.

    Sometimes this might mean:

    • Declaring a  new “Champion”
    • Refining a new “Challenger”
    • Or scrapping the hypothesis.

    The most impressive results come from having a culture of ongoing experiments. It will take some time but ultimately the Product Manager can recruit others in their team (developers, QA, growth hackers) to propose other experiments.

    Statistical Significance

    Picking the right metric

    Running experiments are only useful if:

    • You selected the correct “Success Metric” to examine. In Contextual we allow you to automatically chart your “Success Metrics” comparisons, but we also allow you to “what-if” other metrics. Contextual:
    • automatically captures screen visits and button clicks without you needing to a-priori think about it.
    • allows you to sync data from your backend systems so you can measure other out-of-band data like purchases or loyalty points etc.

    A/A/B or A/A/B/B Testing

    It has become more common to also duplicate identical running of an experiment to eliminate any question of statistical biasing using the A/B tool. If there is a variation between A–A or B/B is “statistically significant” then the experiment is invalidated and reject the experiment.

    Sample Size and Significance

    If you toss a coin 2 times its a lousy experiment.  There is an awesome Derren Brown “10 heads in a row” show. Here’s the spoiler video! If you remember back to your statistics classes at College/University the “standard error” (not “standard deviation”) of both A and B need to NOT overlap in order to have significance.

    Where T = test group count and C = converts count and 95% range is 1.96, Standard Error is:

    I’ll do a whole separate post on it for the geeks but using a calculator in the product is good enough for mortals 🙂
    UPDATE: The geek post is here!

    A/B testing vs multivariate testing

    A/A/B is a form of multivariate testing. But multivariate testing is a usually a more complicated form of experimentation that tests changes to several elements of a single page or action at the same time. One example would be testing changes to the colour scheme, picture used and the title font of a landing page.

    The main advantage is being able to see how changes in different elements interact with each other. It is easier to determine the most effective combination of elements using multivariate testing. This whole picture view also allows smaller elements to be tested than A/B testing, since these are more likely to be affected by other components.

    However, since testing multiple variables at once splits up the traffic stream, only sites with substantial amounts of daily traffic are able to conduct meaningful multivariate testing within a reasonable time frame. Each combination of variables must be separated out. For example, if you are testing changes to the colour, font and shape of a call to action button at the same time, each with two options, this results in 8 combinations (2 x 2 x 2) that must be tested at the same time.

    Generally, A/B testing is a better option because of its simplicity in design, implementation and analysis

    Summary

    Experiments can be “spray-and-pray” or they can be run with a discipline that provides statistical certaintly. I’m not saying its an essential step and the ONLY metric you want to apply to your App engagement – but as tools become available to make this testing possible you have the foundations to make it part of you culture.